Outline Link to heading
Overview Link to heading
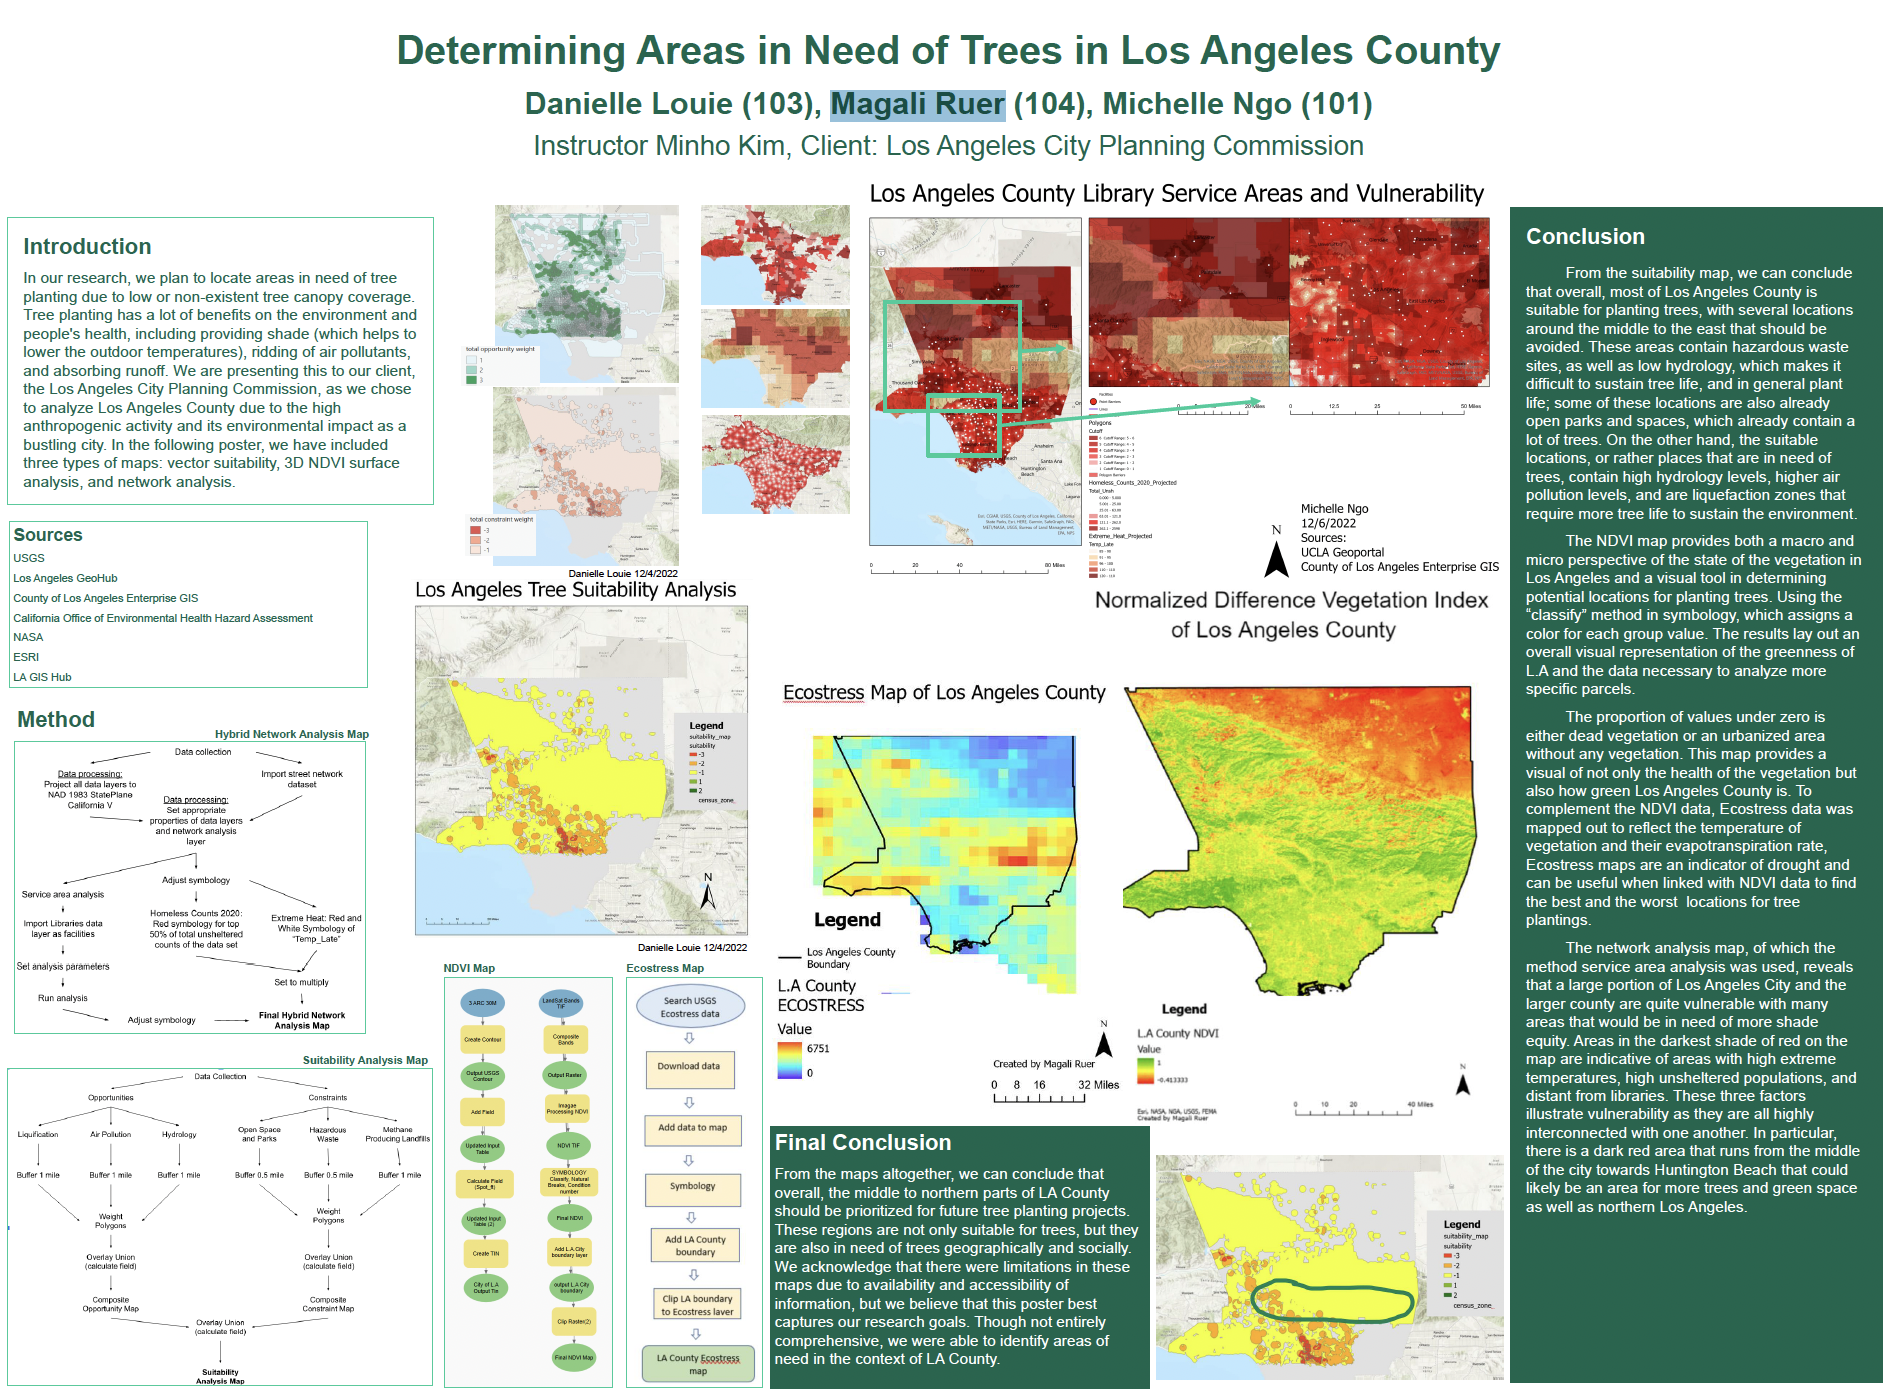
The objective of this project was to determine areas in Los Angeles in need of tree coverage. We simulated a presentation of our report as though we were addressing the Los Angeles City Planning Commission. In conclusion, we found that Los Angeles was highly suitable for planting trees, and additionally, it was also in need of trees (for their shade) to ensure a sustainable environment.
Method Link to heading
While conducting our research, we each developed Analysis Maps to draw out the processes we planned to take to create our desired maps. The processes included importing specific libraries, identifying categories that data belongs to, and specific techniques to manipulate data visualization.
Maps Link to heading
A total of three maps were made: Suitability Analysis Map, Library Service Areas and Vulnerability Map, and an NDVI/Ecostress Map.
Suitability Analysis Map (By Danielle Louie) Link to heading
The Suitability Analysis Map identified three opportunities and constraints in Los Angeles for planting trees. Opportunities were viewed as characteristics of areas that were in need of trees and were able to sustain them; this project focused on areas with high concentrations of liquefication, air pollution, and existing hydrology. On the other hand, constraints were characteristics that decreased the need for trees or were inhabitable to plant them; we focused on existing open space and parks, hazardous waste, and methane producing landfills.
Each category had its data weighed, overlaid, and then combined into one main map that showed the ranges from most to least suitable based on the combined weights of opportunity and constraints in Los Angeles.
Library Service Areas and Vulnerability (By Michelle Ngo) Link to heading
This Network Analysis Map was used to identify areas in the City of Los Angeles that were in need of shade equity. Areas that faced extreme, high temperatures, had high levels of unsheltered populations, and were distant from libraries were identified as more vulnerable communities. The most vulnerable communities can be represented by the darkest shade of red mapped.
Normalized Difference Vegetation Index (NDVI) (By Magali Ruer) Link to heading
The NDVI/Ecostress Map uses a “classify” method to display the varying levels of vegetation in Los Angeles. Our project provided both a macro and micro perspective to show the overall differences in vegetation levels, as well as identify key areas that are in need of tree plantation.
Conclusion Link to heading
Based on the three maps created, we identified that the middle to northern parts of Los Angeles were in the most need for tree plantation. These areas were identified to have high vulnerability, low vegetation, and high suitability.
Poster Link to heading

Sources Link to heading
- USGS
- Los Angeles GeoHub
- County of Los Angeles Enterprise GIS
- California Office of Environmental Health Hazard Assessment
- NASA
- ESRI
- LA GIS Hub
Acknowledgements Link to heading
This project was conducted with Michelle Ngo and Magali Ruer during the 2022 Fall Semester of GEOGC188 at UC Berkeley through the College of Environmental Design.