Flood Risk in Houston
Analyzing Urban Design Factors and Infrastructure Contributing to Vulnerability
Outline Link to heading
Abstract Link to heading
As climate change increases the intensity of storms, cities must improve their urban infrastructure to adapt to severe environmental disasters. The present study investigated six factors in Houston’s urban design to understand the city’s vulnerability to flooding: precipitation patterns, storm sewer systems, pavements, land use, topography, and socioeconomic demographics. When comparing the findings for each factor, we found that low-income Hispanic, White, and African American communities were more likely to face flood risks; these communities had higher numbers living in industrial and commercial regions along the coast, which are prone to severe flooding but face ineffective storm drainage due to prominent infrastructure made from impervious surfaces (concrete, asphalt, etc.). In addition, low-income communities live in neighborhoods that lack proper storm sewer drainage systems, exacerbating flash floods and dangerous flood points. We recommend that Houston improve its urban design equitably to decrease flood vulnerability and ensure the city’s sustainability in the future.
Introduction Link to heading
Similar to many other low-lying municipalities in the United States, the city of Houston, Texas has encountered significant flood risk for much of its history. However, these concerns were substantially heightened following the impact of Hurricane Harvey in August of 2017. The category four storm had brought tremendous amounts of precipitation and damage to southeastern Texas, especially the Houston metropolitan area. In the aftermath, large portions of the city experienced severe flooding that impacted residential areas and transportation infrastructure for multiple weeks. We aim to establish a potential link between the flooding caused by Hurricane Harvey and the role of infrastructure and urban design in exacerbating the effects of climate change. Specifically, we attempt to identify factors governing Houston’s flood risk including but not limited to: precipitation patterns, pavement and road conditions, efficiency of drainage systems, topography, land use, and geographic distribution of household income. In efforts to combine these factors together, we analyze how the city of Houston could not only be severely impacted by future events such as the 2017 floods, but also how vulnerability to natural disasters may drive economic and social inequality from an urban planning perspective.
Our motivation for researching this topic comes from the varied nature of this issue — in other words, its pertinence to climate science, urban data analytics, and social justice. By understanding the lessons from Hurricane Harvey and its effect on Houston city planning, we hope to inform future infrastructure planning efforts that prioritize both economic growth and environmental sustainability, ensuring that cities like Houston are better prepared to face the challenges of climate change and extreme weather.
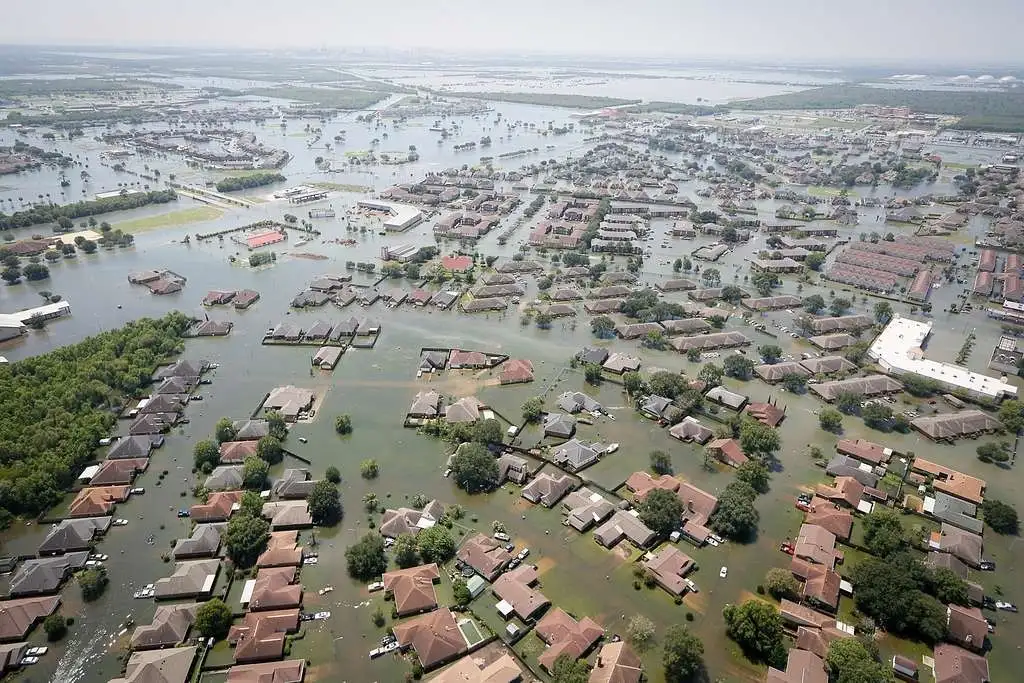 Image: Harris County floods as seen from an aerial view taken on August 31, 2017 (Martinez, 2022).
Literature Review Link to heading
After Hurricane Harvey devastated Houston, a growing amount of attention was directed toward flood statistics. Different types of floods that struck the city were analyzed, and Houston and Harris County began to acknowledge the city’s weaknesses — including climate change, funding, and warning systems (Blackburn & Baker, 2023). The city government began establishing flood mitigation policies and supporting the construction of a new reservoir to increase preparedness against future storms (University of Houston, 2022). Environmental injustice was also brought to attention as several studies conducted found that people of color, people with disabilities, and people with existing health issues were disproportionately impacted by the hurricane (Flores et al., 2020). Studies analyzed the recovery rate of Houstonians to observe the varied recovery rates in different neighborhoods; five years after Hurricane Harvey, 81.6% of survey respondents were either completely or mostly recovered, leaving 29.4% of the respondents still struggling (Strong, 2022).
Furthermore, the destruction left in the wake of the cyclone had raised serious infrastructure concerns for the city of Houston to withstand future storms. The inundation of major interstate freeways and record water levels prompted investigations by the Infrastructure Resilience Division (IRD) and the American Society of Civil Engineers (ASCE) to document the lack of flood resilience of infrastructure with respect to heavy rainfall events (Mostafavi et al., 2022). The total estimated cost of damages caused by the storm hovers at around $125 billion, tied with Hurricane Katrina as the most expensive natural disaster in US history (Mooney, 2018). Despite this hefty price tag, Houston has seen almost no major infrastructure projects constructed in response to Hurricane Harvey (Fulton, 2022). This leaves ample room for discussion about contributing factors and urban planning solutions for Houston with respect to flood prevention.
Methods Link to heading
To conduct holistic research about Houston’s flood vulnerability, we analyzed six urban components in Houston to understand the reasons behind its proneness to flooding and to examine the interplay between various contributing factors, highlighting the unsustainability of Houston’s infrastructure in managing flood risks.
- Precipitation: precipitation patterns were examined for Houston across multiple years to examine how rainfall in 2017 compared to other years. In the context of flooding, our group specifically looked at spikes in weather data graphs that indicate storms or major rainfall events.
- Storm sewer systems: using GIS software, we mapped out the main flood points, storm sewer systems, and floodways to evaluate the effectiveness of Houston’s drainage infrastructure. Pavements: with relevance to Houston’s high concentration of impervious surfaces, the quality of pavement was assessed using the Pavement Conditions Index (PCI). We then created a distribution of Houston’s roads based on their PCI scores to determine overall pavement quality for the metropolitan area.
- Income demographics: mean and median incomes from the American Community Survey (ACS) for Harris County census tracts (2017) are displayed and accompanied by separate visualizations that are filtered by race and ethnic group.
- Topography & elevation: data pulled from USGS (US Geological Survey) was used to generate a detailed elevation contour map of Houston as well as the surrounding suburbs.
- Land use: polygons representing land use data, provided by the City of Houston, have also been mapped and grouped into ten different categories based on their general purpose. We also provide an overlay of the topography and land use maps using Carto GIS software.
The data and findings for these six sources are discussed in detail in the subsequent ‘Results’ section. One key feature of our methods is that much of the data has been compiled and visualized in order to highlight noteworthy patterns; however, we concede that there are potentially other factors that may not be included in this analysis as well.
Results Link to heading
Precipitation Link to heading
To understand the influence of weather on floods in Houston, we analyzed daily precipitation patterns from 2017 to 2023 and calculated the mean amount in inches for each year.
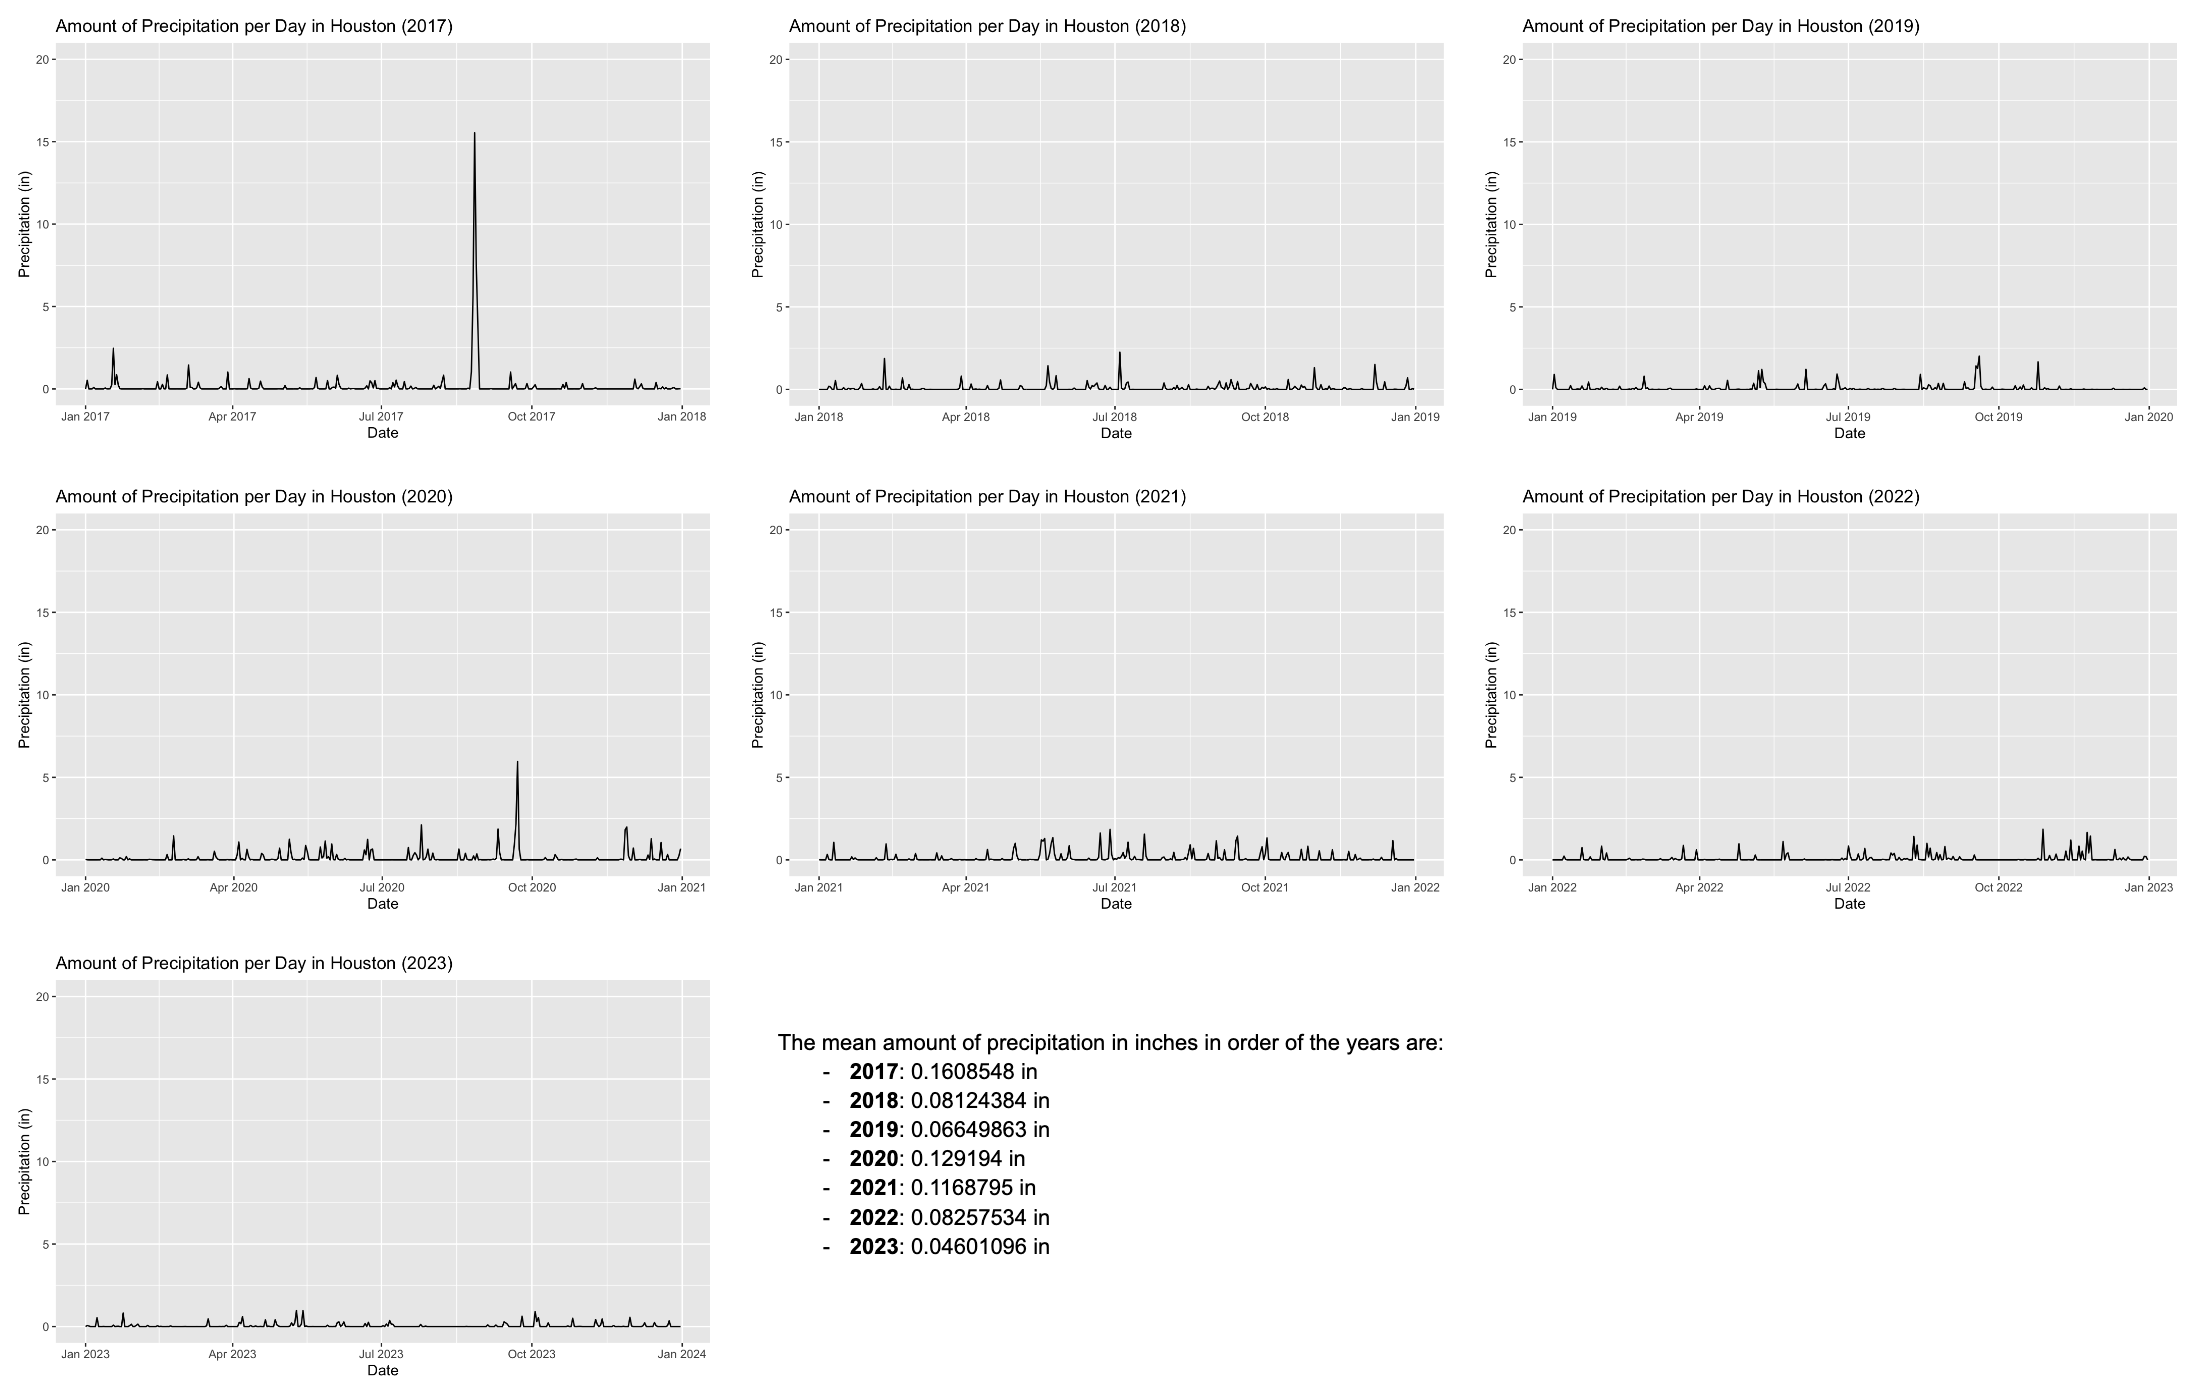 Figure 1a: In the seven line graphs above, there were noticeable spikes in 2017 and 2020. The line graph for 2021 also showed more continuous rainfall throughout the year compared to other years.
The spike in the 2017 graph represents the timeframe when Hurricane Harvey hit (August 17 to September 2), and the spike in 2020 represents when Tropical Storm Beta hit (September 17 to September 23). In addition, 2021 faced a lot of rainfall throughout the year due to Hurricane Nicholas, leading it to have the third-highest annual average precipitation within the seven years depicted.
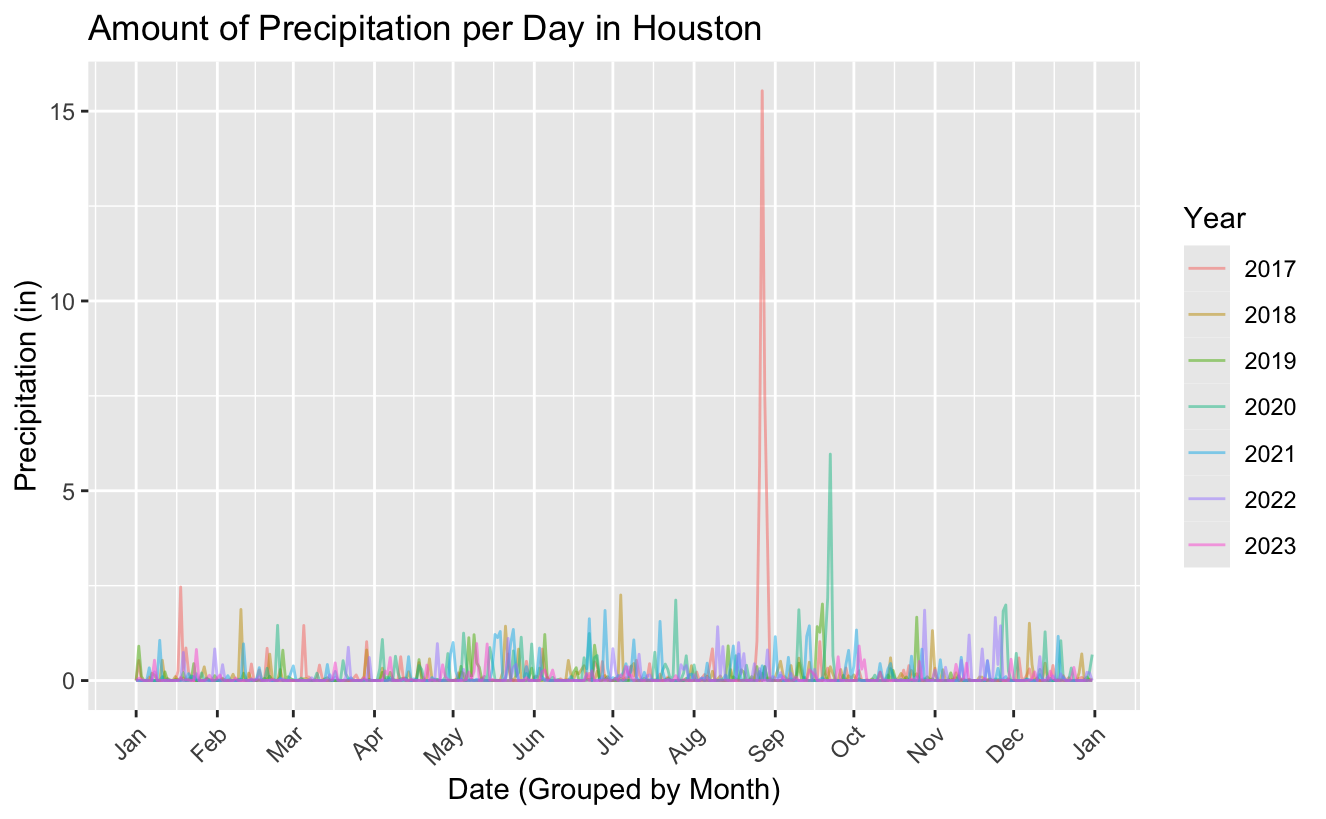 Figure 1b: The graph above depicts the seven years overlaid on a single plot, demonstrating the severity of torrential rain that occurred in 2017 and 2020.
According to the City of Houston, Houston is a coastal city prone to flooding all year round (Houston Police Department, n.d). Due to its complex yet intensely used road infrastructure, the urban design comprises many impervious surfaces throughout the city. In fact, it only takes “2 inches in an hour [to] flood streets” (ABC13 Houston, 2017); it can be inferred that Houston’s streets are vulnerable to small amounts of rain and lack the infrastructure to drain flood water effectively. Torrential rain renders storm sewer systems obsolete as water pools faster than they can drain, creating dangerous flash floods on both main roads and neighborhood streets. As climate change increases the intensity of storms, Houston needs to reshape its urban design to accommodate higher levels of precipitation. In 2024, Houston has already experienced a derecho (series of windstorms and thunderstorms) in mid-May, as observed by NASA (NASA Earth Observatory, 2024). Currently, Houston is facing Hurricane Beryl, with combinations of torrential rain, storm surges, tornadoes, and high wind speeds, exacerbating flood risks in the city.
Storm Sewer Systems Link to heading
Despite Houston’s vulnerability to flooding as a coastal city, its storm sewer system has essentially been deemed “obsolete” (Borenstein & Bajak, 2017). For our research, we focused on comparing the location of storm sewers in 2017 to the high flood points that Hurricane Harvey caused. The interactive map below shows a portion of a larger map that depicts a total of 574 severe floodpoints and 529 storm sewers. Severe flooding occurred more often in major floodway paths, especially closer to the coast. Additionally, several storm sewer systems exist where there are no floodways, and many that are located near major floodways appear to have minimal infrastructure (as shown by their space occupancy). The evidence of multiple severe floodpoints at or past storm sewer systems indicates that the existing storm sewers likely overflowed, signifying ineffective draining and poor design; these conditions can also lead to more disastrous impacts that spill past main floodpaths due to sudden movement of large quantities of water, commonly in the form of flash floods.
Figure 2: The interactive map above can be toggled to show the relationship between floodways, severe floodpoints, and the sewer systems.
Pavements Link to heading
Pavement quality is measured according to the Pavement Conditions Index (PCI), where pavements are measured on a scale of 0 to 100, with 100 indicating a newly constructed road (Metropolitan Transportation Commission, 2021). Most roads aim to have an average PCI score of at least 70, indicating a “satisfactory” road that only needs minor maintenance, such as crack sealing or seal coating (City of Waseca, 2020). For our research, we analyzed the material type and PCI scores of 73,289 roads in Houston.
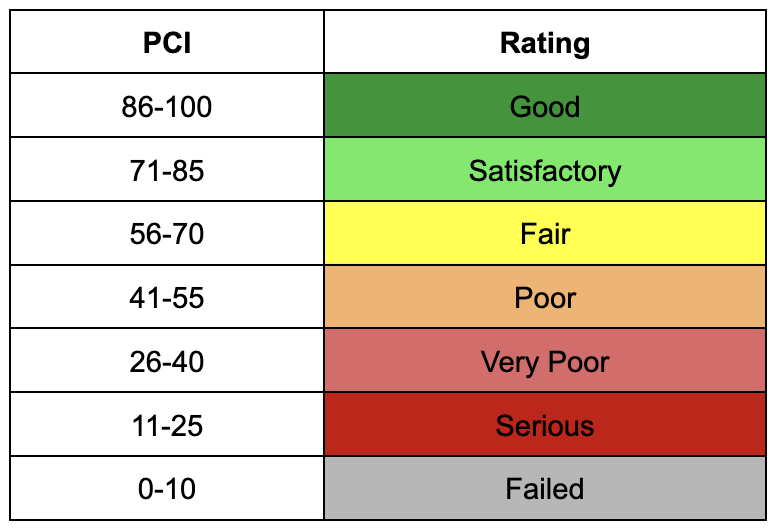 Figure 3a: The chart above shows the different ratings of pavement condition based on the interval of PCI scores that a road receives.
All roads observed were made from one of two types of concrete: Asphalt Concrete (AC) or Portland Cement Concrete (PCC). A main difference between the two materials is their corrosion failure mode; AC is prone to sunlight damage (which weakens asphalt by causing faster oxidation), whereas PCC is vulnerable once water and salt seep into its steel reinforcements. AC roads are also considered more flexible while PCC roads have more rigid infrastructure. Houston has 39,681 PCC roads, slightly more than the 33,608 AC roads in the city, to support heavy vehicle usage; however, this also means that the majority of Houston roads are more susceptible to corrosion by water intrusion. In addition, due to the intensity of storms, AC roads are also easily damaged from the constant impact of precipitation on top of vehicle burden.
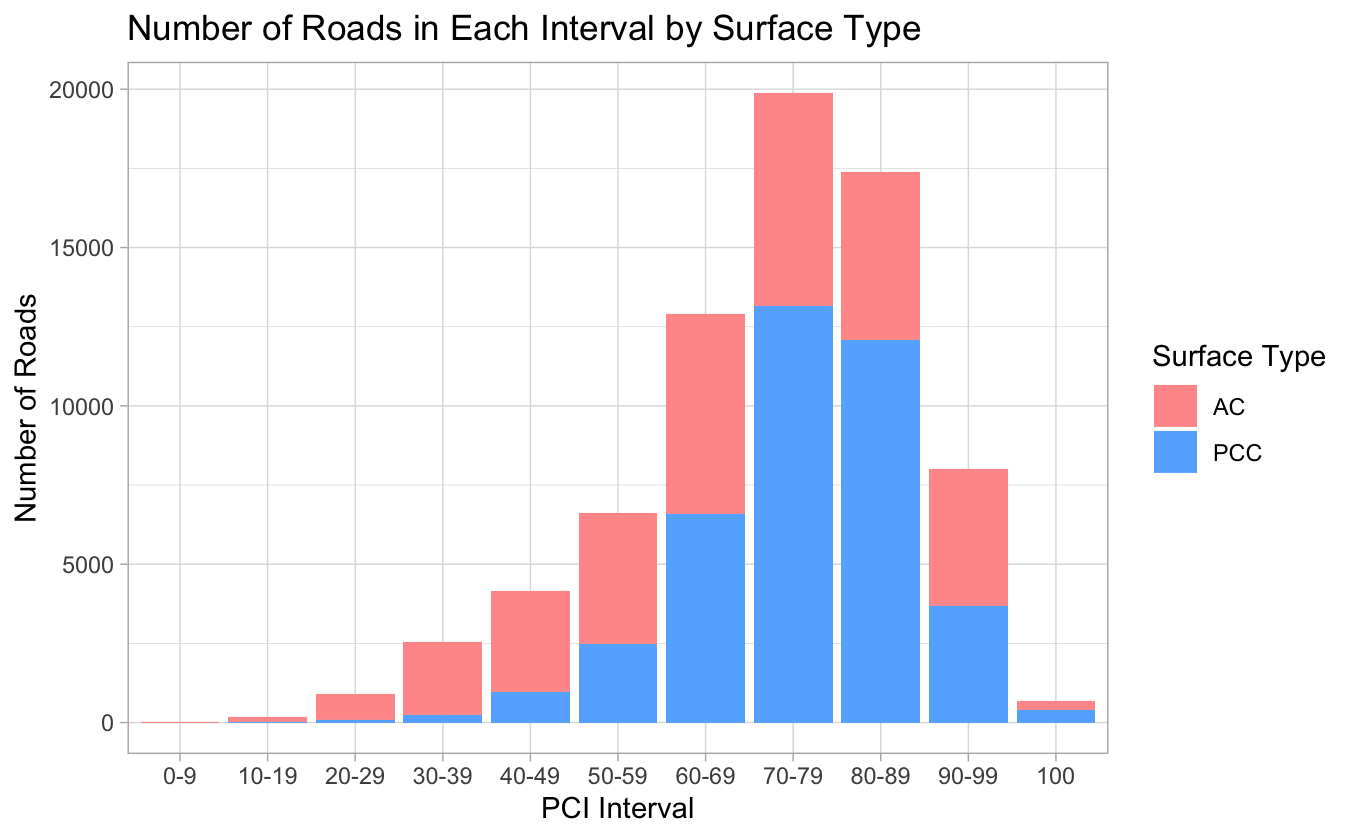 Figure 3b: The bar graph above depicts the distribution of PCI scores for all 73,289 roads, as well as the ratio of road types for each interval.
As depicted above, the graph is skewed left with most roads in fair or better condition, and the average PCI score of all roads was 71.8394 (satisfactory). However, 15.2% (11,151 roads) had a PCI score of 55 (poor) or below, and 39.4% (28,898 roads) scored below satisfactory. Of these roads, 52.5% of AC roads (17,658 out of 33608 AC roads) and 28.3% of PCC roads (11,240 out of 39681 PCC roads) were below satisfactory standards. This indicates that over a third of the roads require significant reconstruction. In fact, in 2020, Houston was ranked 22nd for worst roads across the United States (ABC13 Houston, 2020).
Income Demographics Link to heading
The following data was produced using ACS (American Community Survey). The subdivisions for each region were by census tract. An important side note: requests to use GeoJSON files to upload this spatial data in GIS have been denied. While the data may be public, certain forms of downloading may be restricted due to its sensitivity.
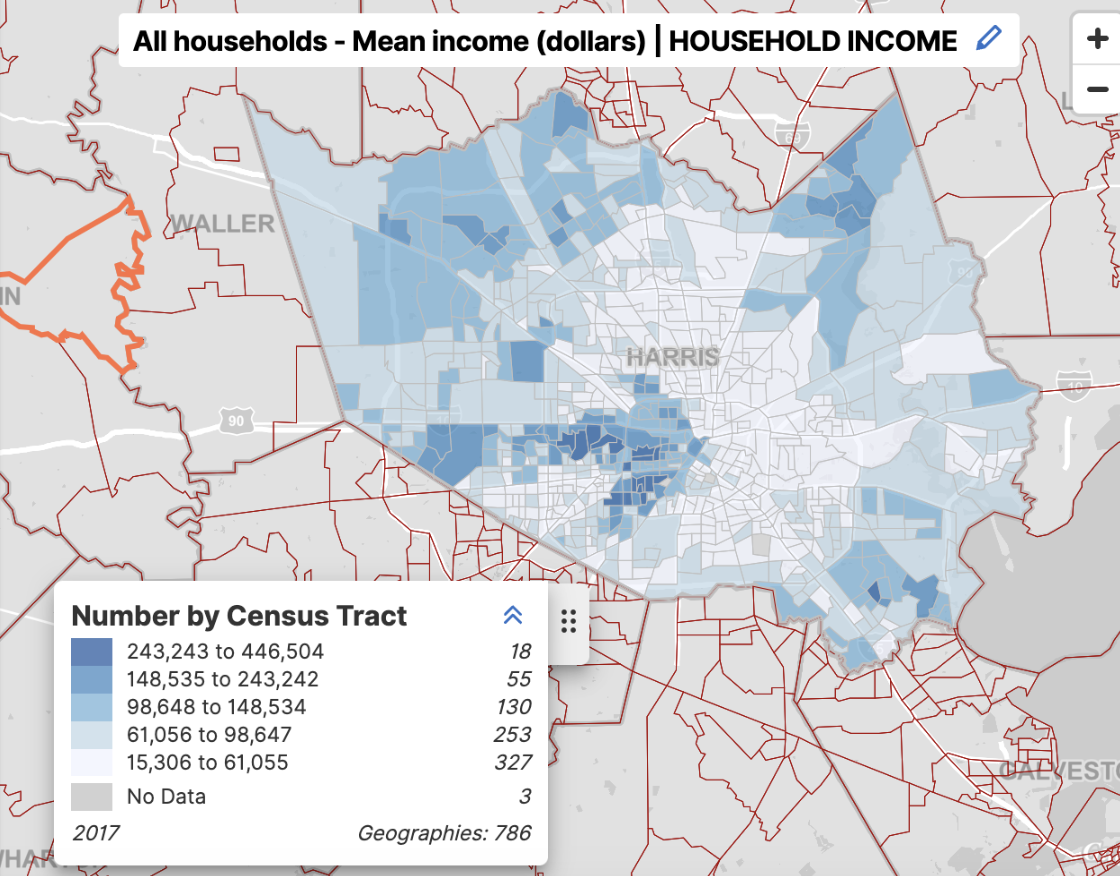 Figure 4a: Mean incomes for Harris County by census tract (US Census Bureau, 2020).
Shown above are the mean income of households for the Houston area. Census tracts within Harris County were chosen, as a large portion of the metropolitan area falls nicely within the county lines for statistical review. Upon inspection, more of the wealth is concentrated to the north and western portions of the city, however, distant suburbs in general make up a higher income profile as a whole. The immediate southeast of downtown is shown to be situated in the lowest income bracket, indicating the higher presence of poverty in Houston’s inner city.
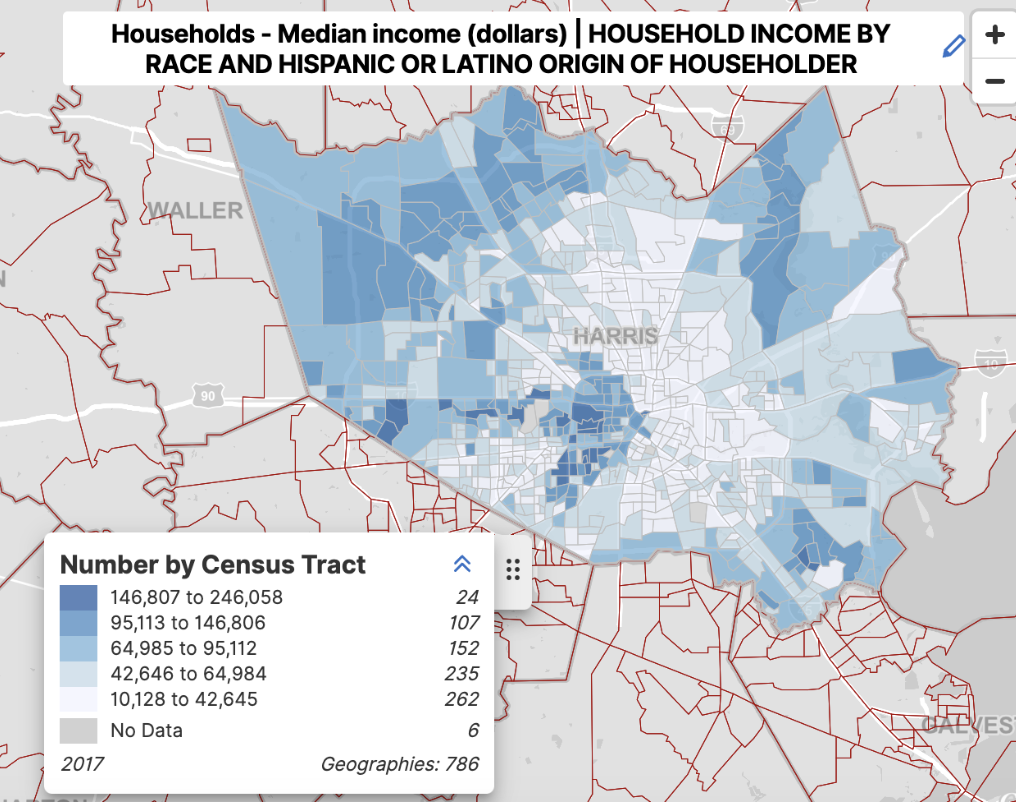 Figure 4b: Median incomes for Harris County by census tract (US Census Bureau, 2020).
The median income map displays similar patterns with more of the wealth concentrated in the north and west suburbs. However, there is a slightly higher median income in the more distant suburbs, especially to the northwest of the county. The signs of a lower-income inner city follow a similar outline to the previous mean income map. Geographically, this poorer region is located closer to bodies of water, likely making up some of the swampier sections of Houston. Below are some of the median incomes by race:
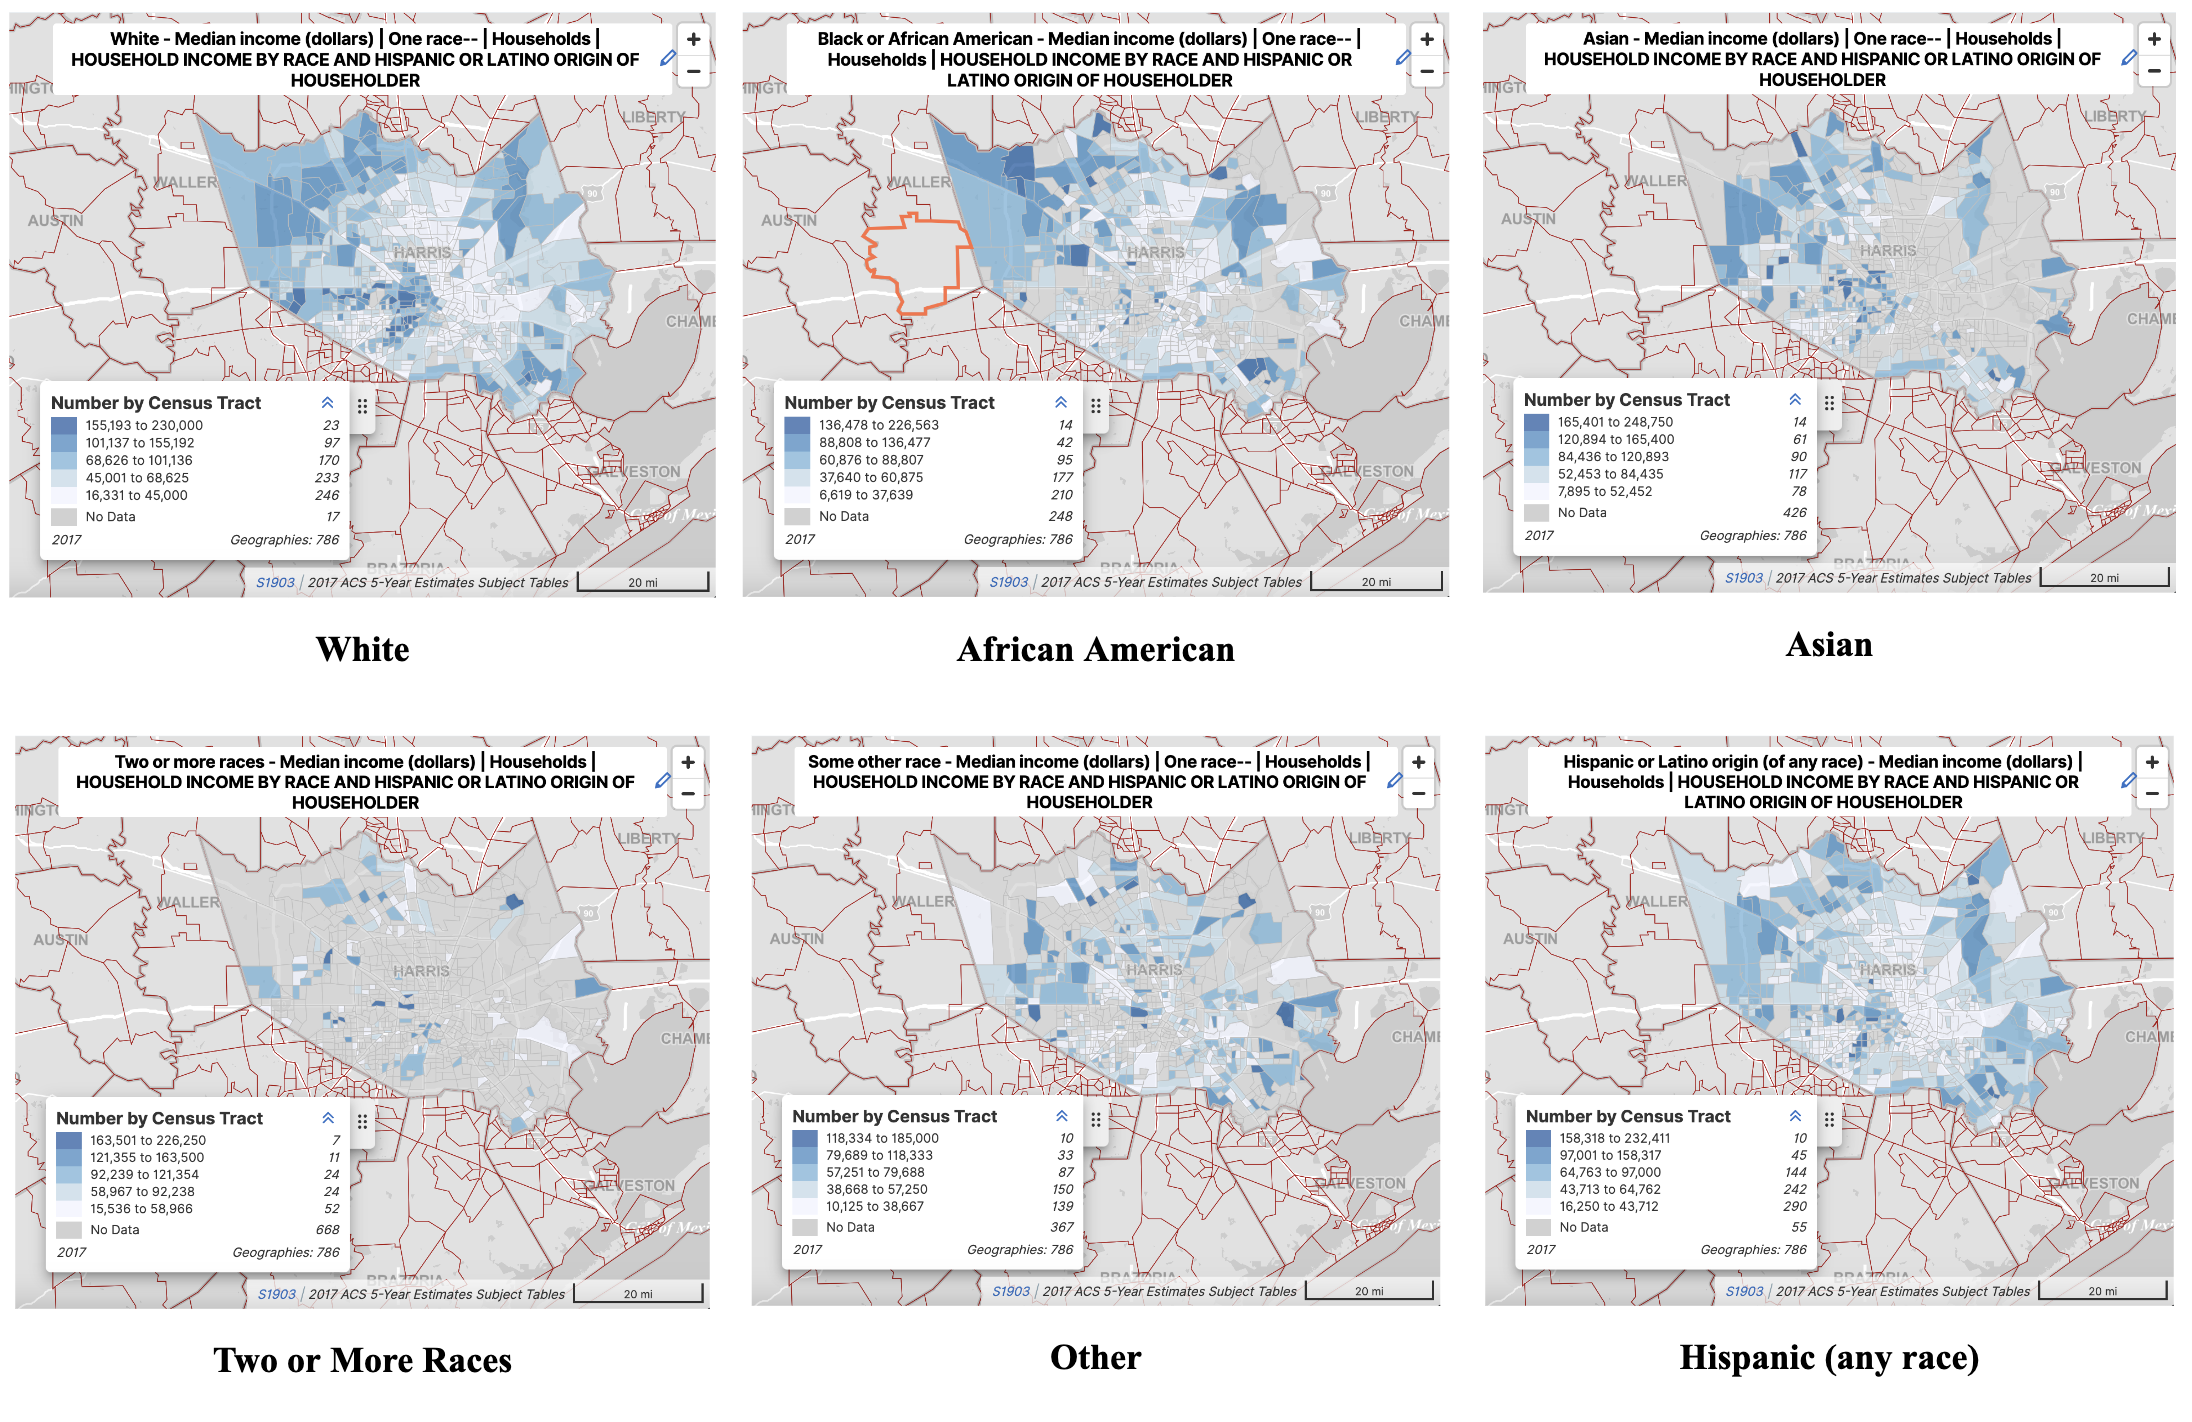 Figure 4c: Median incomes for each race in Harris County by census tract (US Census Bureau, 2020).
Topography and Elevation Link to heading
Below is a contour map of the Houston area with contours marking different elevations. Color coordination was chosen based on the varying elevations. This way, we could indicate which contour lines were at higher elevations (blue) and which ones were at lower elevations (yellow).
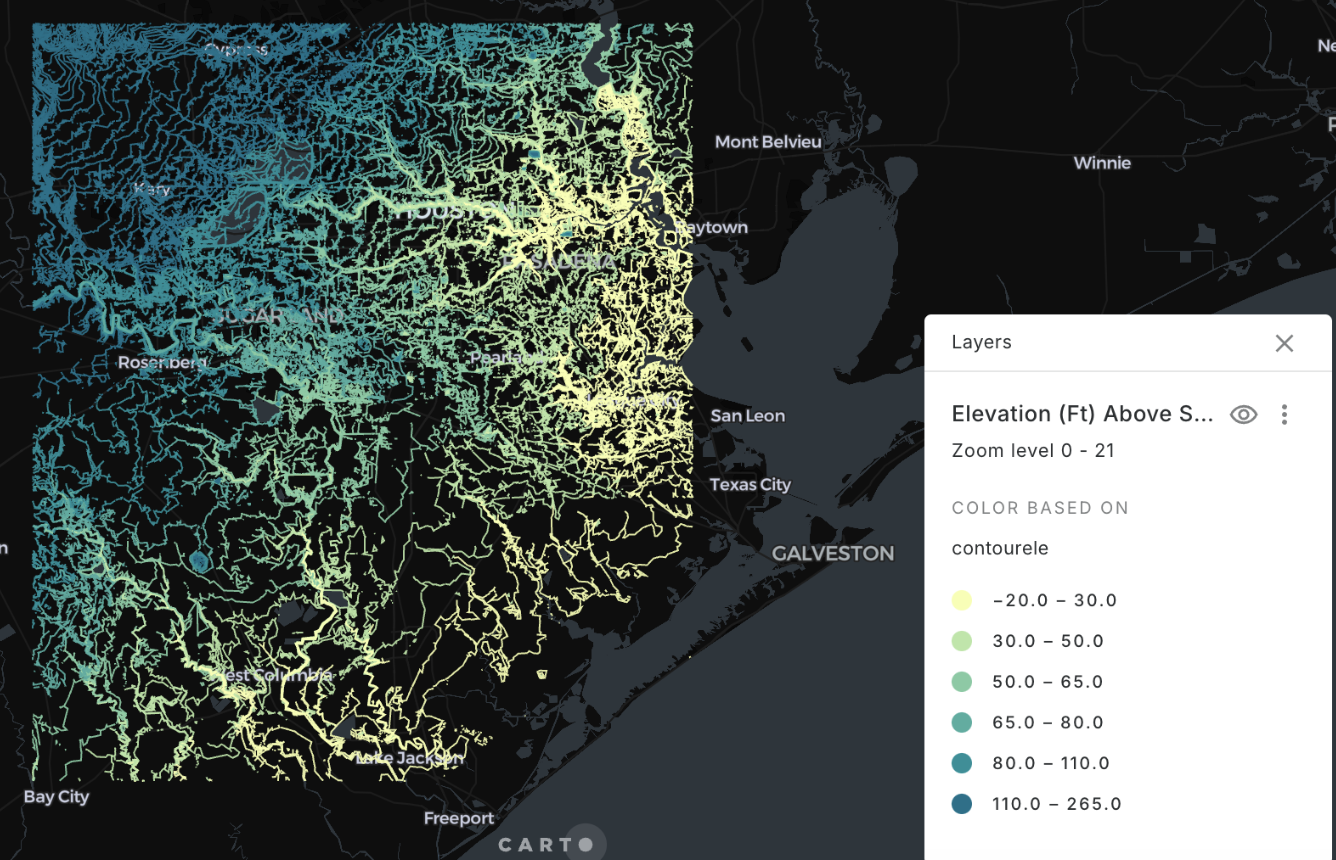 Figure 5: Elevation contour map of the Greater Houston area (US Geological Survey, 2022).
We can see that southeastern portions of the city were not only closer to the gulf and other bodies of water, but they were more prone to flood risk as well, given the prevalence of yellow lines in that region. More interestingly, we can even deduce where Houston’s major waterways and rivers are by the dendritic patterns on its landscape. Another major feature is the notable separation of contour lines in the northwestern and southern portions of the city, creating favorable topological conditions for both agriculture and urban sprawl. One important aspect to note is that the range of altitudes does not vary much throughout the city. This range is only on the order of 200-300 feet, which is quite low relative to other cities in the US. In that case, although the scaling of this visualization is adjusted to bring out these topological differences, most of the city (even the higher portions) are still at risk of flooding to some degree.
Land Use Link to heading
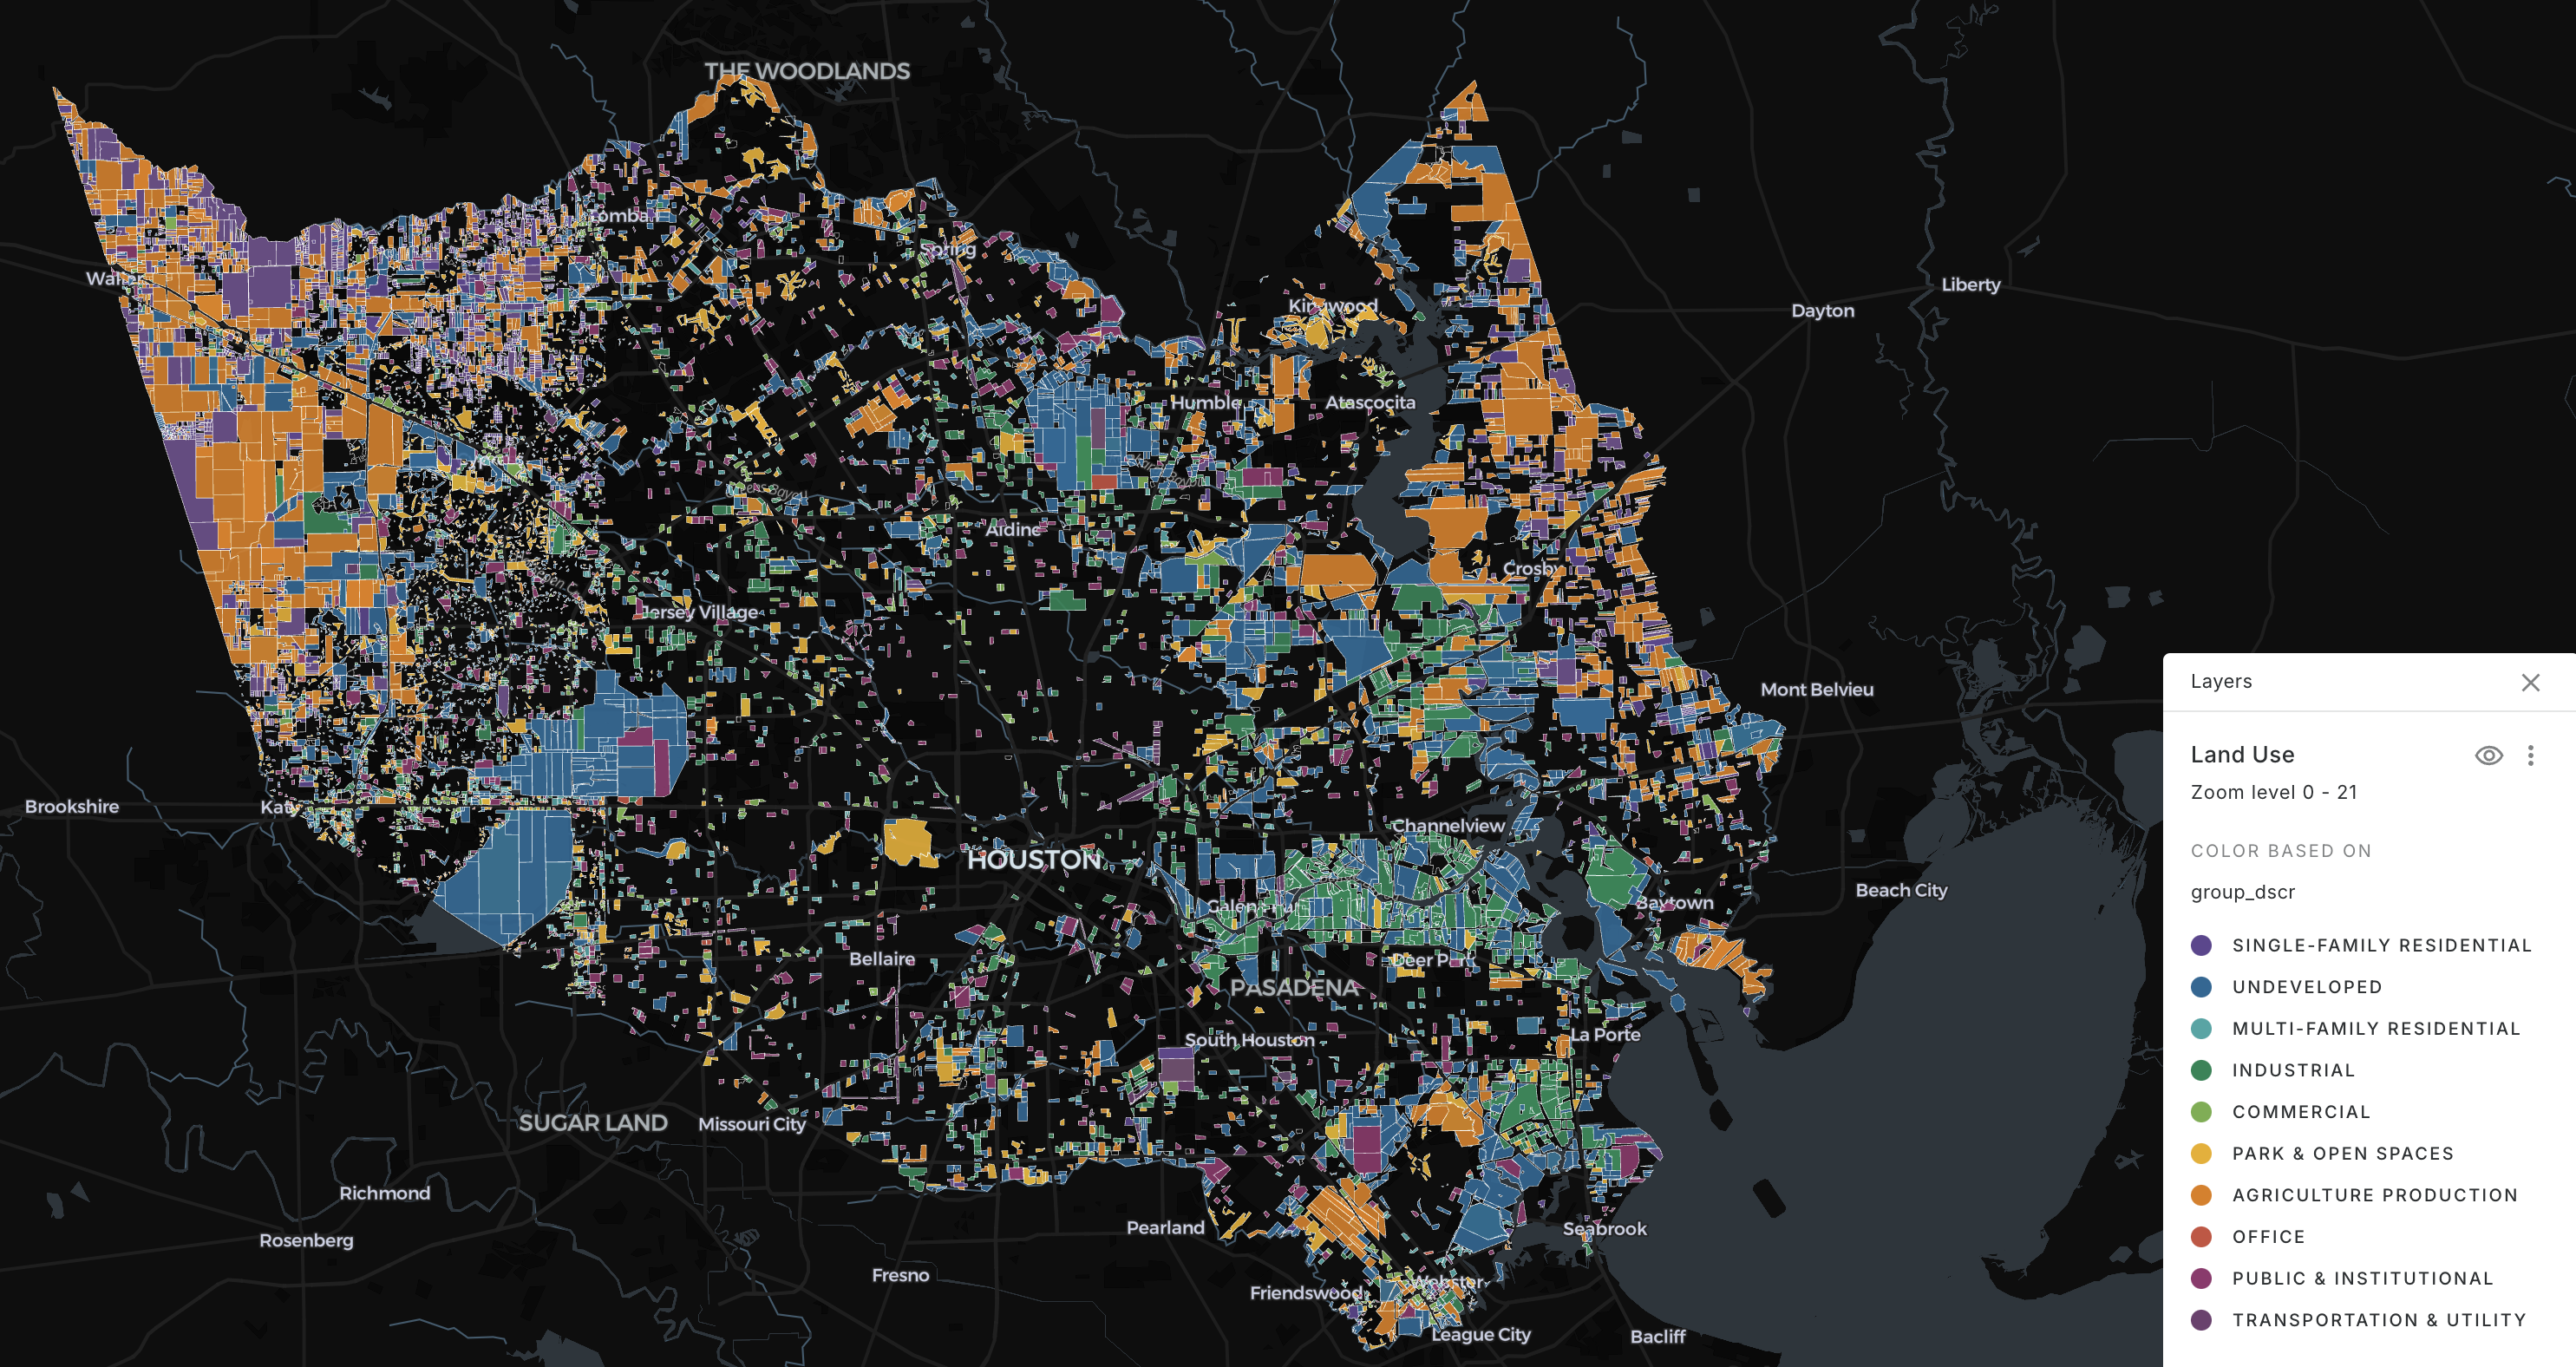 Figure 6: Land use map of Harris County, Texas (City of Houston, 2022).
This visual represents the land use across the city of Houston. While the dataset used contains more specific categorizations of these land uses, the data was grouped into ten different categories that outline zoning patterns within the city. The most noticeable pattern is northern Houston’s abundance of single-family residential development (purple) and agricultural land (orange), especially in the northwest corner. Another key attribute of this is the concentration of industrial and commercial land in the southeastern portion of the city (both in shades of green). There is a visible belt of this industrial and undeveloped land (blue) that is located in this region, with an even narrower gap running through it, indicating a major waterway called the Buffalo Bayou connecting the city center to the Gulf of Mexico. The presence of impervious substances (concrete, asphalt, etc.) located near such waterways exacerbates flooding concerns. One final characteristic worth mentioning is that Houston’s more distant suburbs have larger plots that determine land use. It is probable that increased zoning area is a direct result of urban planning adopting a more homogenized approach in these areas. This appears to break down closer to the city center (according to the collected data), and closer to the lower elevation parts of the city.
Overlay of Elevation & Land Use Data A simultaneous application of both visualization layers provide a key comparison between urban development and topology for the city of Houston. The positive relation between industrial land and lower elevations is fairly straightforward to identify, indicating compounded flood danger for certain areas. Agricultural land use is generally seen in parts of the city that see more contour line separation, indicating flatter land. Meanwhile, several parks and open spaces (yellow) are located near riverfronts in downtown and suburban residential areas.
Figure 7: The interactive map above overlays the elevation and land use maps, showing the relationship between the two features.
Discussion Link to heading
From our observations, we noticed correlations between flood vulnerability and low-income communities. Demographically, Hispanic, White, and African American communities were more prominent than other races in the southeastern regions of Houston, where the majority of low-income neighborhoods resided. These coastal regions are mainly used for industrial and commercial purposes, likely indicating higher concrete infrastructure. In addition, the low elevation allows for larger flooding of the river paths that flow from the ocean into Houston; unfortunately, there is little to no existing storm sewer infrastructure in these areas, which creates a high risk of severe flooding — as shown also by the severe floodpoints from Hurricane Harvey. It can be deduced from our data that low-income Hispanic, White, and African communities in Houston are more vulnerable to this severe flooding. Therefore, the urban design of Houston creates an environmental disparity stemming from marginalizing communities socioeconomically.
Moreover, the geography of Houston has also raised the probability of unwelcome floods due to the city’s low elevation. Even more alarming is the significant overlap between industrial land uses and low-lying plains that are adjacent to the city’s waterways. It is our concern that the concentration of these industrial zones in more flood-prone areas will lower Houston’s overall resilience toward future hurricanes. However, it is crucial to observe that much of Houston’s land area contains natural floodplains as well. The presence of flat, undeveloped land is therefore inherently designed to inundate — even when communities that aren’t infrastructurally designed to mirror this behavior are built next to or within these areas (Harris County Engineering Department, 2018). These flatter plots of land without a natural waterway outlet nor access to a man-made drainage system would therefore pose a risk to urban development in the area. Using income demographics we obtained from ACS, we can determine that susceptibility to floods are indeed occupying similar areas. Relative to downtown, these targeted low-income neighborhoods lie to the immediate northeast and the far south portions of Harris County (see Figures 4 & 7). In general, these overlaps have nonetheless shaped our analysis and added nuance to our understanding of flood risk across the city.
A key limitation to our data would likely be the scope of information collected. For instance, the map of categorized land uses (Figure 6) comprised only a fraction of the developed land in Houston. Additionally, the land uses shown were only for Harris County, and we would like to widen our lens to encompass multiple counties as well. This way, we could better illustrate the flood risk of Houston’s outer developments and introduce a cross-analysis of flood risk and urban sprawl. Another limitation of the data, and perhaps ethical concern, is the sensitivity of the data that outlines racial patterns across multiple neighborhoods in conjunction with median incomes. That being said, while we were able to interact with the data on the ACS website, it seemed we could not download the data and process it in any meaningful way. Lastly, with 2017 being our choice of study, there is a small discrepancy between years for some of our graphics based on the information we could find. Our goal was to paint the most accurate picture we could of the factors responsible for the Hurricane Harvey floods, and so we prioritized years that were closest to 2017 rather than the most up-to-date information. A potential tangent for additional study would also acknowledge the need for comparison across other Gulf cities such as Corpus Christi, Texas or New Orleans, Louisiana.
In terms of the city’s recovery path, programs such as Project Recovery (Project Recovery, 2017) and Disaster Recovery 2017 (City of Houston, 2023) have helped galvanize the process of building resilience in neighborhoods devastated by Hurricane Harvey. However, current programs fail to identify the need for special attention towards marginalized communities that were disproportionately impacted and face more struggles in recovery. Future developments of these recovery programs should identify and address vulnerable communities to better understand how to help communities that require different resources and solutions for future resilience against climate change.
Conclusion Link to heading
The findings of this paper underscore the vital need for targeted improvements in Houston’s urban infrastructure to address flood vulnerability, particularly in low-income communities disproportionately affected by severe flooding. The analysis of precipitation patterns, storm sewer systems, pavements, land use, topography, and socioeconomic demographics reveals a complex interplay of factors contributing to flood risk. It is evident that communities with insufficient storm drainage infrastructure and significant exposure to impervious surfaces are at heightened risk during extreme weather events.
To mitigate these risks and enhance the city’s resilience, Houston must prioritize equitable urban planning and invest in sustainable infrastructure solutions. This includes upgrading storm sewer systems, implementing green infrastructure practices, and revising land use policies to reduce the concentration of vulnerable populations in high-risk areas. By addressing these challenges holistically, Houston will not only reduce flood risks by relying less on impervious surfaces, but the city would also promote social equity and environmental sustainability.
As climate change continues to increase the frequency and intensity of storms, the lessons learned from this study can inform strategies to protect not only Houston but other low-elevation or flood-prone cities across the globe. Through proactive and inclusive urban planning, cities can better safeguard their populations and ensure a more resilient future in the face of escalating environmental challenges.
References Link to heading
- Argüelles et al. (2022). The Impact of Hurricane Harvey. University of Houston. https://uh.edu/hobby/harvey/
- Blackburn, J., & Borski, J. (2023, August 22). Assessing Houston’s Flood Vulnerability 6 Years After Harvey. Baker Institute. https://www.bakerinstitute.org/research/assessing-houstons-flood-vulnerability-6-years-after-harvey
- Borenstein, S., & Bajak, F. (2017, August 29). Houston Drainage Grid “so obsolete it’s just unbelievable.” CBC News. https://www.cbc.ca/news/world/houston-harvey-drainage-1.4267585
- City of Houston. (2021, June 17). City of Houston Land Use. COHGIS Data Hub. https://cohgis-mycity.opendata.arcgis.com/datasets/coh-land-use/explore
- ity of Houston. (2023, August). Disaster Recovery 2017 (DR17). Housing and Community Development Department. https://recovery.houstontx.gov/dr17/
- City of Waseca. (2020). Pavement Condition Index (PCI). Discover Waseca. https://www.ci.waseca.mn.us/engineering/pages/pavement-condition-index-pci Flores, A. B., Collins, T. W., Grineski
- S. E., & Chakraborty, J. (2020). Social vulnerability to Hurricane Harvey: Unmet needs and adverse event experiences in Greater Houston, Texas. International Journal of Disaster Risk Reduction, 46, 101521. https://doi.org/10.1016/j.ijdrr.2020.101521
- Fulton, W. (2022, August 29). Houston is still reckoning with the biggest lessons from Hurricane Harvey: Kinder Institute for Urban Research. Kinder Institute for Urban Research | Rice University. https://kinder.rice.edu/urbanedge/houston-still-reckoning-biggest-lessons-hurricane-harvey
- Harris County Engineering Department. (2018, July). Floodplain information. https://www.eng.hctx.net/Consultants/Floodplain-Management/Floodplain-Information
- Houston Police Department. Emergency 9-1-1 Police Non-Emergency. https://www.houstontx.gov/police/pdfs/brochures/english/turn_around_dont_drown.pdf
- How much rain causes flooding? (2017, August 24). ABC13 Houston. https://abc13.com/rain-rainfall-flooding-houston/2339080/
- Martinez, D. (2022). Climate Change Exacerbated Hurricane Harvey’s Flood Damage, Hitting Low-income and Latinx Neighborhoods Disproportionately Harder. photograph. Retrieved August 5, 2024, from https://www.lsu.edu/mediacenter/news/2022/08/climate-change-harvey.php.
- Metropolitan Transportation Commission. (2021, March 17). Pavement Conditions Index (PCI). https://mtc.ca.gov/operations/programs-projects/streets-roads-arterials/pavement-condition-index
- Mooney, C. (2018, January 8). Hurricane Harvey was year’s costliest U.S. disaster at $125 billion in damages. The Texas Tribune. https://www.texastribune.org/2018/01/08/hurricane-harvey-was-years-costliest-us-disaster-125-billion-damages/
- Mostafavi, A., Padgett, J., Dueñas-Osorio, L., Sutley, E., Norton, T., Lester, H., Wang, H., Dong, S., Sichani, M., Farahmand, H., Jimenez, E., Esmalian, A., Coleman, N., Dargin, J., Zhou, X., & Lee, C.-C. (2022, October 22). Hurricane Harvey Infrastructure Resilience Investigation. DesignSafe. https://www.designsafe-ci.org/data/browser/public/designsafe.storage.published/PRJ-3735
- NASA Earth Observatory. (2024, May 22). Derecho Darkens Houston. https://earthobservatory.nasa.gov/images/152843/derecho-darkens-houston
- Project Recovery. (2017). Project Recovery Making a Difference for Harris County Residents. Harrisrecovery.org. https://www.harrisrecovery.org/#:~:text=Project%20Recovery%20exists%20to%20assist
- Strong, S. (2022, August 25). Some Houstonians Still Struggling Five Years After Harvey. University of Houston. https://uh.edu/news-events/stories/2022-news-articles/august-2022/08252022-harvey-anniversary-flood.php#:~:text=The%20survey
- United States Census Bureau. (2020). All Households - Mean income (dollars). American Community Survey. https://data.census.gov/map/050XX00US48201$1400000/ACSST5Y2017/S1902/S1902_C03_001E?t=Income%20(Households,%20Families,%20Individuals)&y=2017&layer=VT_2017_140_00_PY_D1&loc=29.8345,-95.5757,z7.6388
- United States Census Bureau. (2020). Households - Median income (dollars). American Community Survey. https://data.census.gov/map/050XX00US48201$1400000/ACSST5Y2017/S1903/S1903_C03_001E?t=Income+%28Households%2C+Families%2C+Individuals%29&y=2017&layer=VT_2017_140_00_PY_D1&loc=29.6489%2C-95.3893%2Cz7.8318
- United States Geological Survey. (2022, August 19). USGS NED 1/3 arc-second Contours for Houston W, Texas 20220819 1 x 1 degree Shapefile. National Geospatial Technical Operations Center. ScienceBase. https://www.sciencebase.gov/catalog/item/5cb16d2ee4b0c3b006574d24
- Whaley, K. (2020, August 11). New Study reveals nearly one third of Houston roads are in poor condition. ABC13 Houston. https://abc13.com/condition-of-houston-roads-new-study-quality-in-road-construction/6365235/
Acknowledgements Link to heading
This project was conducted with Kobe Bilstad during the 2024 Summer Session of CYPLAN 101 at UC Berkeley through the College of Environmental Design.